 Deutsch
 English
 Español
 Français
 Nederlands
You can use the Manager report to analyze your property’s performance. The numbers in this report match those in the Accounting report when you select the appropriate filers. You can learn more about matching the Accounting report and the Manager report here.
If you are unsure about any of the figures in the Manager report, use the Accounting report in Detailed mode to cross-reference.
To view the Manager report:
- on the Dashboard, in the Reports section, click on
or
- go to the main menu
> Finance > Manager report.
Note: You can access a Beta version of an updated Manager report in Mews Operations. You can learn more here.
In this article you can learn the following about the old Manager report:
Setting the filters in the report
Use the filters to review your property's previous day's performance, or month to date and year to date performance, or to run the daily statistics for the past month.
- Mode: Select the mode to display results according to:
- Day: One column for each day, plus totals.
- Month: One column for each month within the selected time period, plus totals.
- Month overview: One column for day and one for month. The day column includes data from the last day of the selected interval. The month column includes month-to-date information based on the selected end date. For example, if you select June 29 - July 3, you can only see data from July 1 - July 3.
- Quarter: One column for each quarter, plus totals.
- Week: One column for each week, plus totals.
- Year: One column for each year, plus totals.
- Year overview: One column for day, one for month and one for year. The day column includes data from the last day of the selected interval. The month column includes month-to-date information from the month of the last day of the selected interval. The year column includes year-to-date information from the year of the last day of the selected interval. For example, if you select August 8th 2023 - January 3rd 2024, you can only see data from Jan 1st 2024 - Jan 3rd 2024.
- End: Select an end date to restrict results to a specific time period.
- Group by: Select one of the following options to group results by:
- Accounting category: To view revenue based on the Accounting categories built in your system.
- A None category in the report means that there are one or many space categories with no Accounting category assigned. Although this does not affect your revenue or statistics, it affects the allocation of available spaces.
- Mews recommends that you add an accounting category in the Space category configuration.
- Accounting category classification: To view revenue based on your Accounting category classifications. Note: If there is a None category, as previously explained this means there are one or many Space categories with no Accounting category assigned. You need to add them in the Space category configuration.
- Service: This is the default filter and groups revenue by your bookable service and products associated with the bookable service. This includes all Accounting categories, including the None category, where category None means there's no Accounting category assigned.
- The default "Service" filter or the "Accounting category" filters are the frequently used Group by filters and for more detailed information, you can view the Accounting report.
- Using the Mode "Day" allows you to view a day-by-day report of these filters.
- Status: Select which reservation statuses you would like to include in the results:
- Confirmed
- Inquired
- Optional
- Values:
- Gross value: Total, including item value and tax.
- Net value: Total item value, excluding tax.
- Tax value: Value-added tax, excluding the price of taxed items.
Understanding the fields in the report
Mews groups the report data by Service by default and by Accounting category and Accounting category classification, depending on which Group by filter you apply. Refer to the "Setting the filters section" above for detailed information.
Within each primary group, the report again groups the results according to space type. In addition to information about each space type, each primary group includes the following information:
- Revenue, i.e. daily or nightly: Total sum of the direct revenue for each space type in the group.
- Product revenue: Revenue from products linked to the group, including:
- Service charges,
- Custom items, from Mews Open API and
- Products, that are not canceled.
- Additional revenue: Additional revenue for this group, linked to cancellations and rebates. The report lists deposits here when the Group by filter is set to Service. For all other Group by filters, the report lists deposits here if you haven't created an accounting category for them. Essentially this revenue group includes the following items:
- Canceled nights
- Canceled products
- City taxes. Note: If you have fixed city tax. You can learn more here.
- City tax discounts. Note: If you have fixed city tax.
- Deposits
- Cancellation fees
- Exchange rate differences
- Surcharges
- Rebates
- Total revenue: A total sum of the revenue, product revenue, and additional revenue for this group.
The report displays the following information for all space types set up at your property, whether a Dorm, Room, Bed, Parking space:
- Occupancy: Percentage of occupied spaces in the selected time period.
- Available: Number of available spaces in the selected time period.
- Occupied: Number of occupied spaces in the selected time period.
- Occupied by other service: Number of spaces occupied by a service other than the stay service.
- Out of order: Number of spaces marked as out of order in the selected time period. The calculation of occupancy or ANR does not include Out of order spaces because they are not available for reservation.
- Revenue, i.e. daily/nightly: Revenue linked to this specific space type or any child space type. For example, if a guest books a bed in a dorm for 10 euros, the system lists that revenue as revenue for both beds and dorms. If a guest books a dorm for 10 euros, the system lists the 10 euros of revenue linked to a dorm reservation as revenue for beds.
- Revenue per available: The daily/nightly revenue divided by the number of available spaces of that type.
- Average rate: The daily/nightly revenue divided by the number of occupied spaces of that type.
- Direct revenue (daily/nightly): Revenue linked directly to the booked space type. For example, if a guest books a bed in a dorm for 10 euros, the report lists that revenue as direct revenue for beds. However, it doesn't list the 10 euros as direct revenue for dorms.
- Customers: Number of in-house guests directly booked to the space type during the selected time period.
At the bottom of the report, you can also see the following information:
- Total revenue: A sum total of the total revenue for each primary group.
The Outlets section
If you have set up outlets in your settings, you can track all reported revenue and non-revenue from the Outlets section in the Manager report:
- Revenue: Direct revenue from inventory sales.
- Non revenue: Revenue from gratuities, such as tips, service charges, and gift cards.
Exporting the report
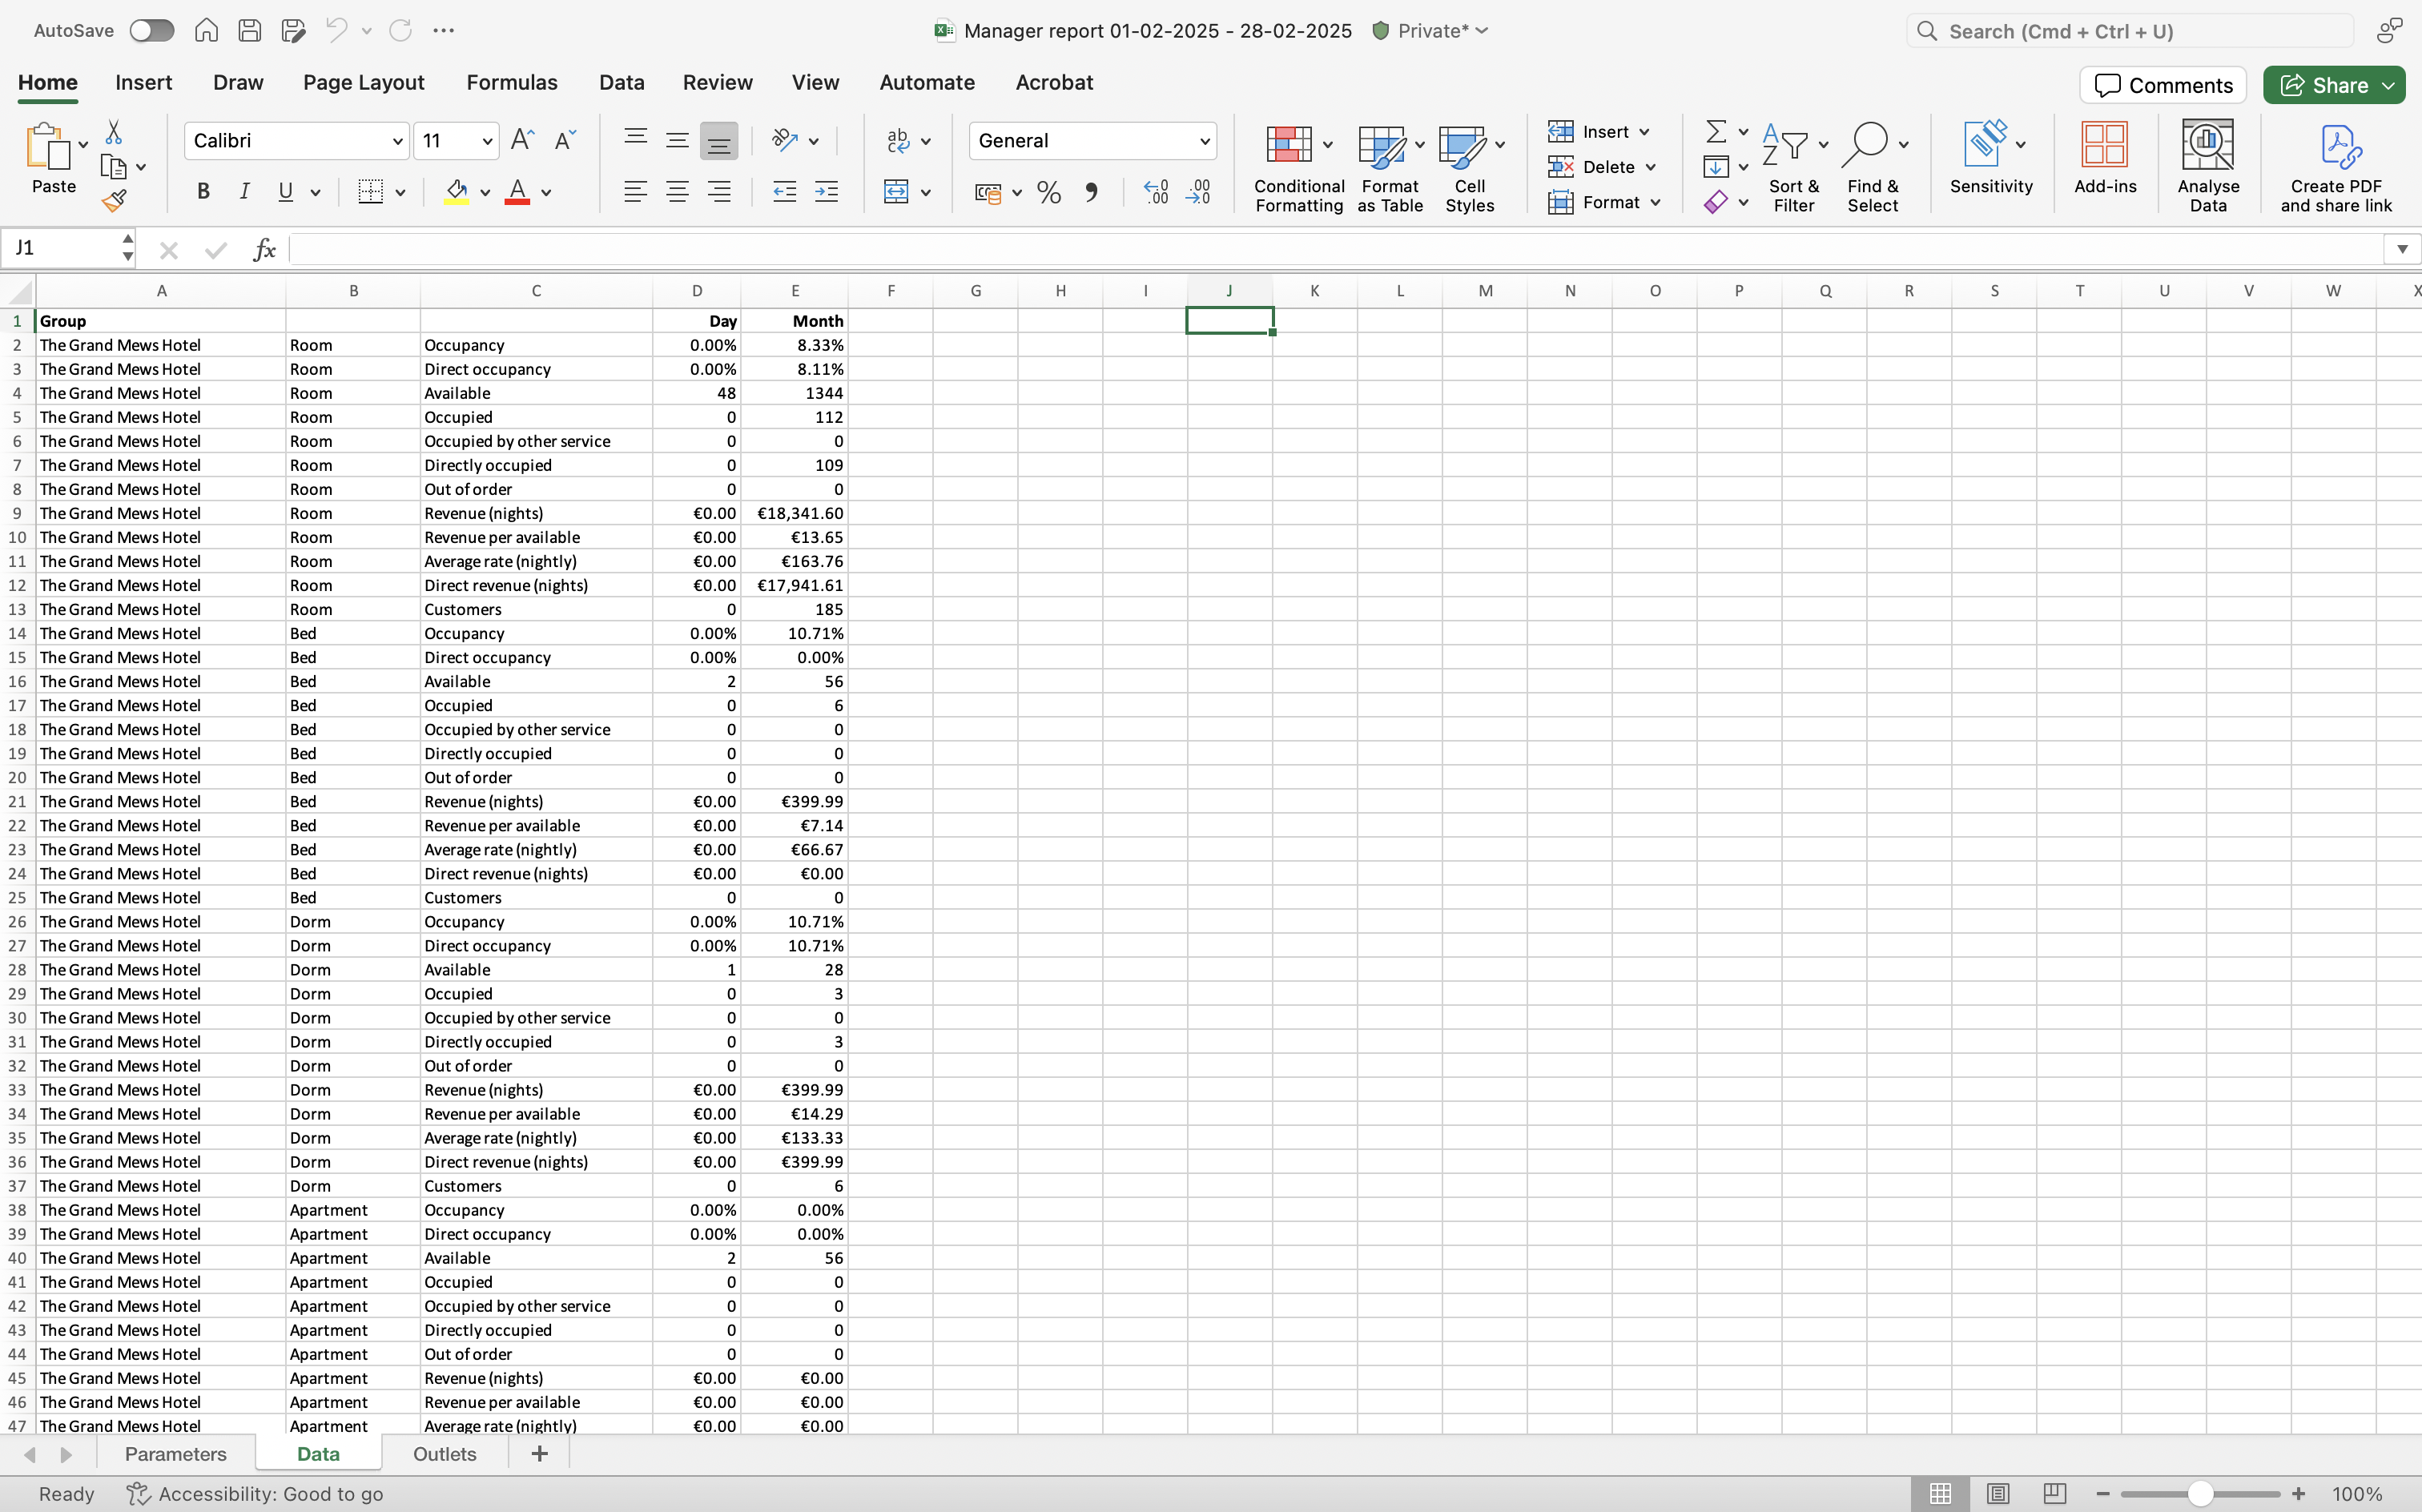
You can export the Manager report in excel sheet format as seen below.
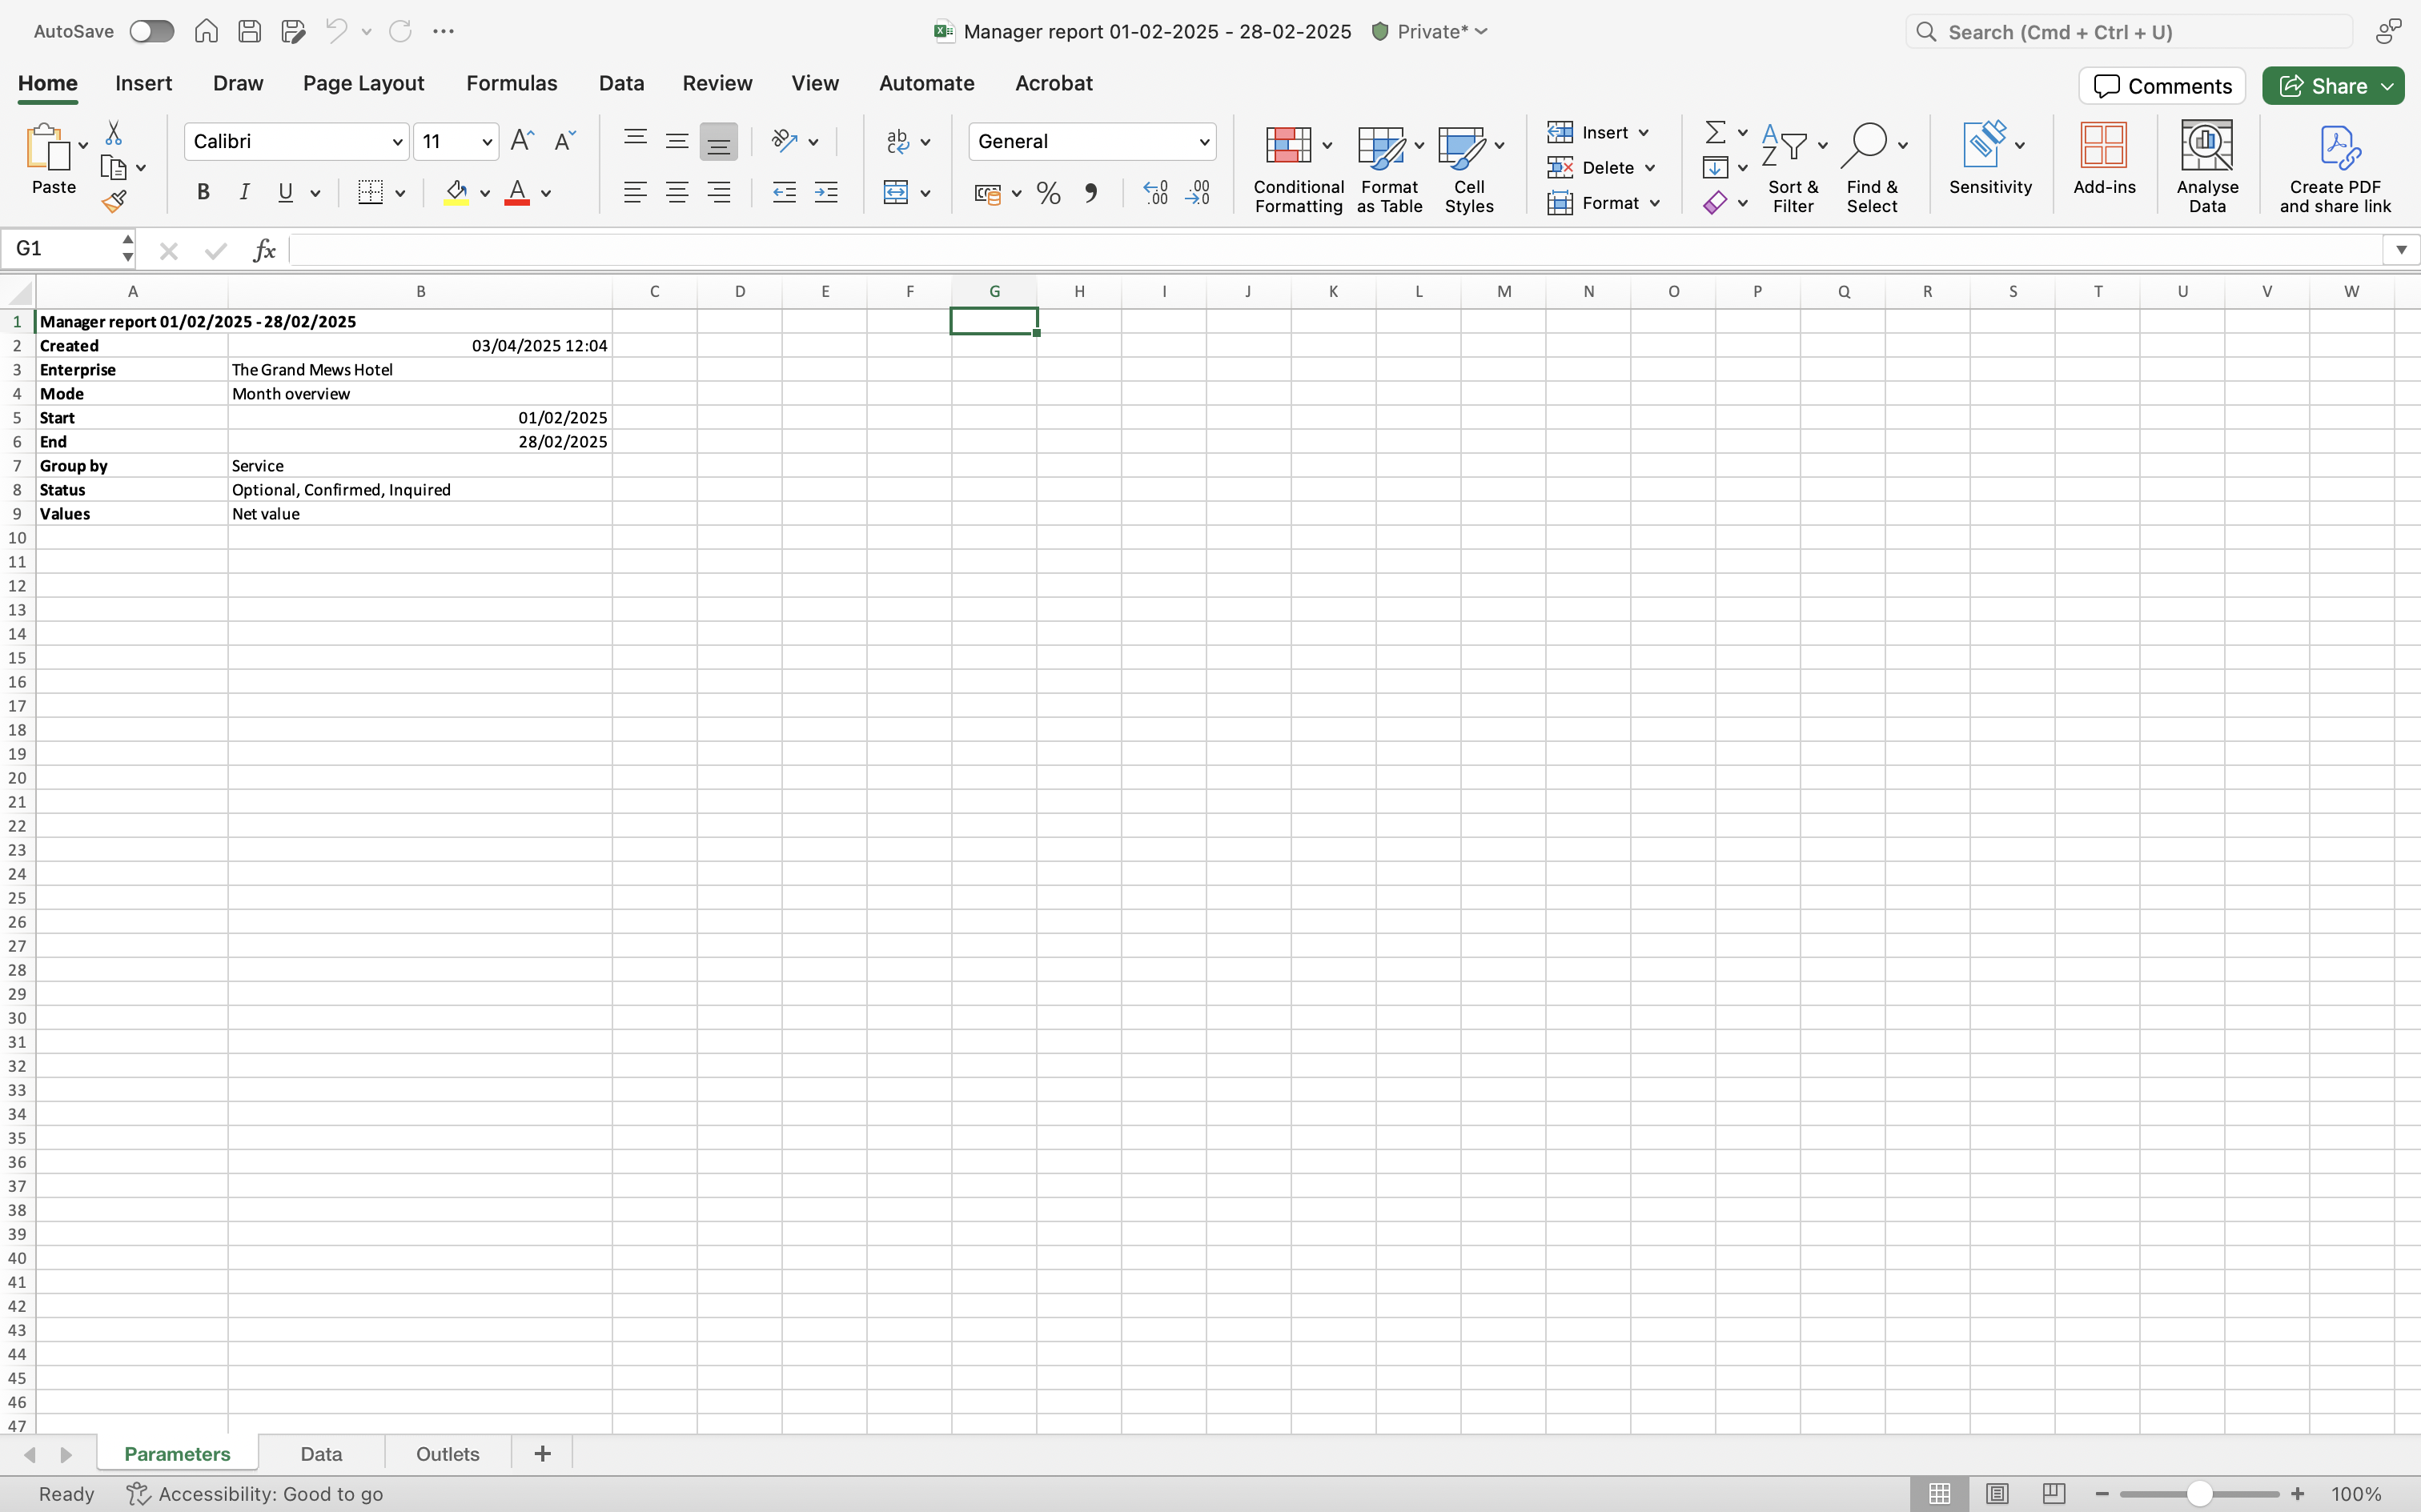
On the Data tab you can see the daily revenues to keep track of your history.
The Directly occupied element
The exported Manager report displays an extra element, Directly occupied, which you don't see in the Mews Operations report.
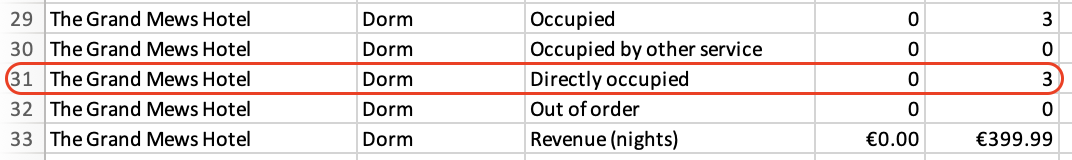
- Directly occupied displays the exact number of assigned rooms or spaces, while
- the system counts overbookings in Occupied.
Indirect occupancy v/s Directly occupied
Alternatively, the following screenshot illustrates when the parent space Dorm, is indirectly occupied, and one bed within is Directly occupied.
Note:
- To view the direct occupancy of a space type check the Directly occupied section in the exported report.
- Mews recommends that you use different space type for parent and child spaces for easier reporting. You can learn more about using space types in Mews here.
You can learn about how to match the Accounting report and the Reservation report with the Manager report here.